Thank you to the Money Marketeers of New York University for inviting me to speak today.1
Money markets are vital to the flow of credit to U.S. households and businesses, and central to the Federal Reserve’s monetary policy implementation. For nearly 75 years, the Money Marketeers has been an essential forum for discussing critical issues related to money markets. I am pleased that this group is continuing to meet virtually in these challenging times, allowing this important dialogue to continue. I look forward to our discussion.
When I last spoke with this group in April 2019, I talked about the recent decision by the Federal Open Market Committee (FOMC) to maintain an ample reserves regime as its long-run framework for implementing monetary policy.2 An ample reserves regime is a version of a “floor” system in which reserves are supplied in sufficient quantity to ensure that control over the federal funds rate and other short-term interest rates is exercised primarily through the setting of the Federal Reserve's administered rates. At the time, I noted two key benefits that the FOMC highlighted in choosing this framework. First, it provides effective control over short-term interest rates in a broad range of environments, including during periods when large amounts of liquidity are needed to relieve stress in the financial system or large-scale asset purchases are required to support the U.S. economy.3 And, second, from an operational perspective, a steady-state ample reserves regime can be simple and efficient to operate.
However, in March, the global financial system experienced an extraordinary shock, triggered by the coronavirus pandemic, and our focus shifted rapidly. The Federal Reserve took swift and decisive action to address the shift in the economic outlook and deteriorating conditions in financial markets. The FOMC cut the target range for the federal funds rate close to zero, and directed the Desk to conduct repo operations and purchases of Treasuries and agency mortgage-backed securities (MBS) to support market functioning. The Federal Reserve undertook a wide range of additional steps—many in coordination with the U.S. Treasury—to support the flow of credit to the U.S. economy, and coordinated with foreign central banks to stabilize dollar funding conditions. Some regulations were also temporarily adjusted to encourage bank lending. These measures, alongside swift and forceful fiscal policy action, succeeded in stabilizing financial markets and averted an even deeper collapse in economic activity.4
Although the pandemic shock itself was unprecedented, the responses that it required—a rapid increase in assets and expansion of liquidity—were the type of actions the FOMC contemplated when choosing an ample reserves regime. And, as expected, the shift to operating at much higher reserve levels has been smooth, allowing the FOMC to focus on supporting the flow of credit to U.S. households and businesses. Today I’d like to talk about this shift to higher reserve levels and our observations on money markets so far, and explain why the Federal Reserve’s framework is well suited to implement policy in this environment.
Let me note that the views I express today are my own and do not necessarily reflect those of the Federal Reserve Bank of New York or the Federal Reserve System.
What Impact Has the Federal Reserve’s Pandemic Response Had on the Balance Sheet and Reserve Balances?
I would like to start with a review of changes in the Federal Reserve’s balance sheet since March. It is the size of the balance sheet and composition of liabilities that determine the level of reserves in the banking system, which, in turn, has a meaningful influence on money market rates and policy implementation.
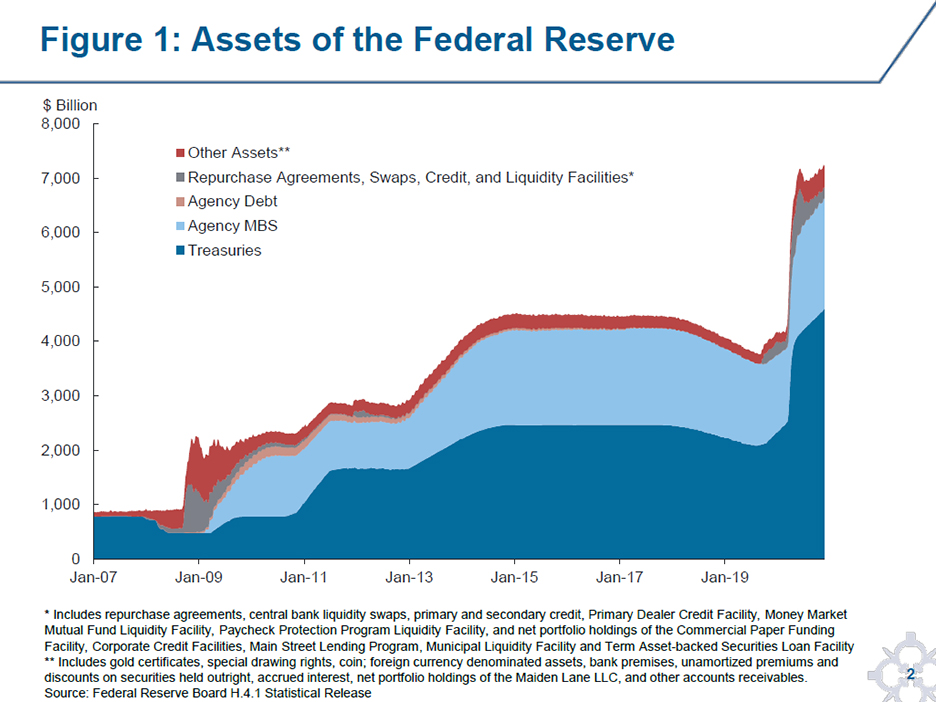
As shown in Figure 1, the Federal Reserve’s balance sheet grew at a historic pace between March and June of this year as a result of the FOMC’s critical actions to support market functioning and the flow of credit to the U.S. economy. Most of the increase resulted from purchases of Treasury securities and agency MBS, shown in dark and light blue. Expanded repo operations and central bank liquidity swaps, as well as credit and liquidity facilities established with the support of the U.S. Treasury—collectively shown in gray—also contributed to this growth.5 More recently, the rate of growth in the balance sheet has slowed. With market functioning significantly improved, outstanding balances across funding operations and credit and liquidity facilities have gradually declined, and the pace of net Treasury and agency MBS purchases has been steady since June.
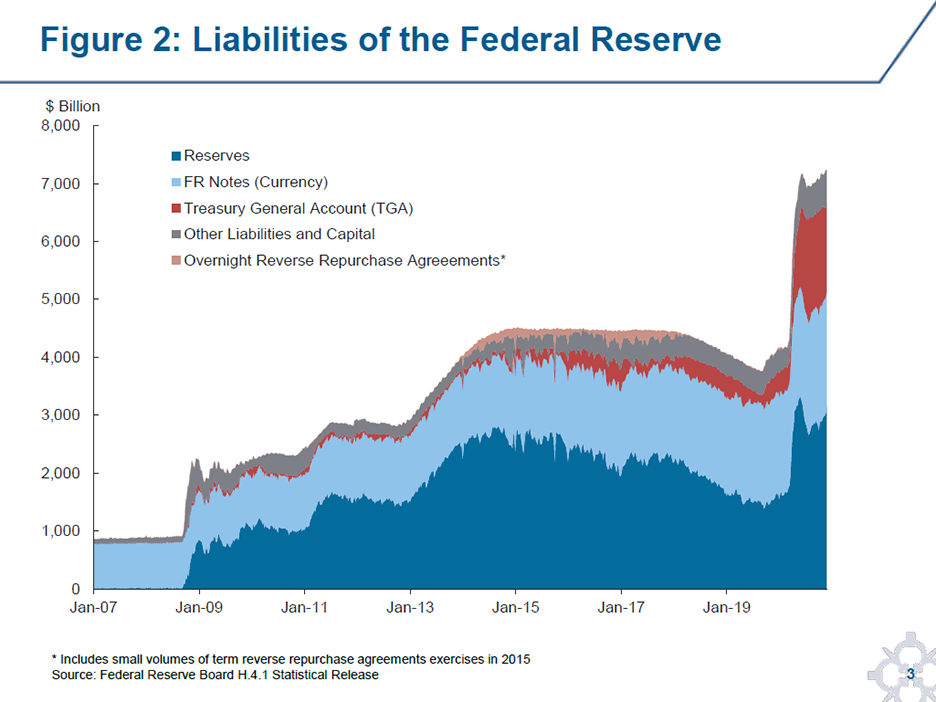
When the Federal Reserve expands its assets, reserves in the banking system increase. This is mechanical; for example, when the Desk purchases securities from dealers, the Federal Reserve funds these purchases by crediting the reserve accounts of dealers’ custodian banks.6 As shown in dark blue in Figure 2, reserves in the banking system grew rapidly during the spring, and have reached a level of over $3 trillion, exceeding the prior peak in reserves, which occurred in 2014.7
In addition to supplying reserves to the banking system, the Federal Reserve maintains an account for the U.S. government, known as the Treasury General Account (TGA), as well as accounts for other domestic and foreign official entities.8 Increases in the balances held in these accounts alter the composition of liabilities on the Federal Reserve’s balance sheet and reduce the level of reserves in the banking system. For example, when investors purchase Treasury debt, funds are transferred from their bank accounts to the TGA.
As shown in Figure 2, the TGA has risen dramatically since March, as the Treasury Department built cash balances to prepare for potentially unprecedented outflows related to the pandemic response.9 Treasury’s cash management policy is motivated by precautionary risk management and calibrated to allow Treasury to cover outflows in case of a temporary interruption to market access.10 The TGA currently stands at roughly $1.5 trillion, nearly four times its largest size prior to this year. This balance is generally expected to fall in the coming months and, while the extent of the decline is uncertain, most expect the balance to remain well above historical norms.
Currency in circulation is another liability that affects the level of reserves. The pandemic increased the public’s demand for currency, likely for both precautionary and transactional purposes. As a result, currency has grown at a rapid pace compared to prior years, increasing by approximately $250 billion since March.
Growth in the TGA, currency, and other non-reserve liabilities has muted the growth in reserves since March; reserve balances would have been about $1.6 trillion higher had these other liabilities remained unchanged. In effect, this increase in non-reserve liabilities has broadened the funding of the expansion in Federal Reserve assets beyond reserves held by the banking system.
Before I move on, I want to highlight one other Federal Reserve liability: the overnight reverse repo, or ON RRP, which currently has no outstanding balance. Unlike other non-reserve liabilities, the overnight reverse repo is used directly as a tool in the Federal Reserve’s operating framework to ensure effective interest rate control. A broad range of money market participants can invest funds in the ON RRP at a fixed rate, placing a floor under overnight interest rates.
How Has the Historic Increase in Reserves Affected Money Markets?
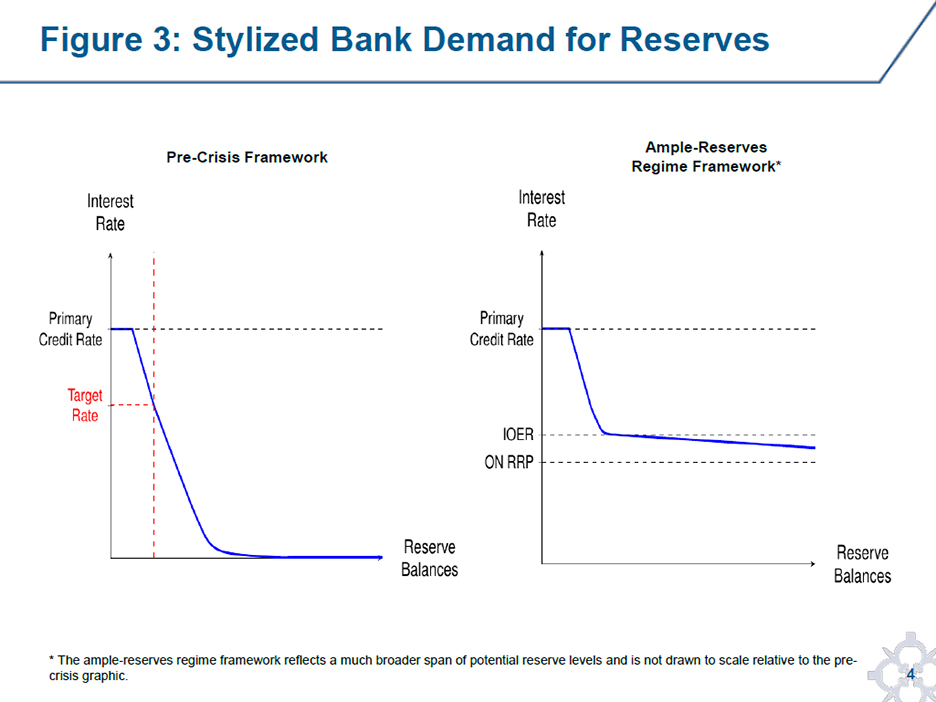
To highlight how reserve supply influences money market rates, Figure 3 shows a stylized depiction of the relationship between the overnight interest rate and banks’ demand for reserves.
Prior to the Global Financial Crisis (GFC), the Federal Reserve operated a regime in which just enough reserves were supplied to meet banks’ reserve requirements and payment needs. In this environment, depicted to the left, the marginal bank borrowed at rates above the interest rate earned on reserves—which at the time was zero—to ensure sufficient balances were maintained to cover payment needs.
In an ample reserves framework, reserves are instead supplied in an amount that leaves most banks with reserve balances above what they need for payments purposes. As a result, many are comfortable investing excess balances when the return on other high-quality liquid assets is above the interest paid on excess reserves (IOER), and also taking deposits at rates near IOER.11 In effect, IOER sets a benchmark for short-term lending and borrowing. This environment is represented by the part of the reserve demand curve that flattens out with rates near IOER, depicted to the right.12
However, when reserves are supplied well beyond what banks require for payments purposes, many may perceive increasing balance sheet costs associated with taking on additional reserves. In this environment, the marginal bank borrows at overnight rates below IOER, as it requires additional compensation to grow its balance sheet further.13 We might consider reserves at this point to be in abundant supply. Even when reserves are abundant, IOER retains its strong influence on rates, although federal funds and many other overnight money market instruments trade at a spread below IOER.
So where are we currently on this graphic?
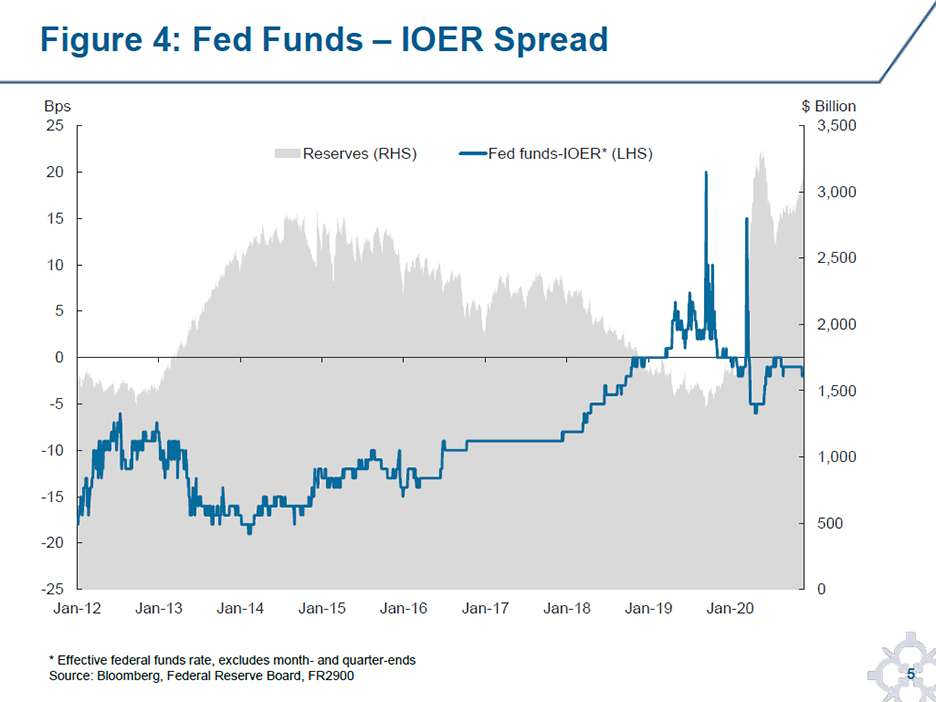
As I’ve described, the supply of reserves has been shifting significantly to the right along this curve. Given this, we may have expected money market rates to be lower than they currently are, reflecting more of an abundance of reserves. However, as shown in Figure 4, the effective federal funds rate has remained relatively close to IOER in recent months—much closer than it was when reserves were at similar levels in 2014.
I’d highlight two main factors that are contributing to this difference.
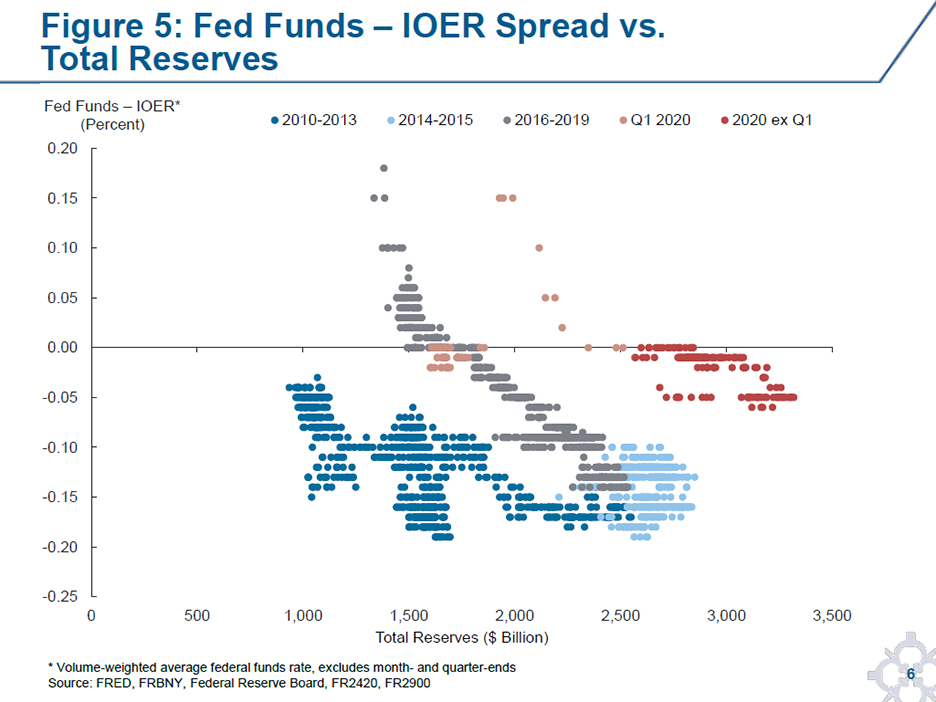
First, banks’ reserve management practices appear to have shifted since March. Figure 5 shows federal funds rates relative to IOER for different levels of aggregate reserves, over the last 10 years, with observations this year shown by the light and dark red dots. Since March, rates have been higher relative to IOER than was the case during the earlier period of abundant reserves, shown by the light blue dots representing observations in 2014 and 2015.
Some of the light red dots represent observations during the highly uncertain days of March, when some banks paid elevated rates to maintain precautionary reserve balances in the face of extraordinary customer demand for liquidity. To better understand this dynamic, the Federal Reserve Board included new questions in the most recent Senior Financial Officer Survey (SFOS), which is a survey of commercial banks that collectively hold around three-fourths of the reserves in the system. Banks that increased their reserve balances from February to April confirmed that a strong desire to hold precautionary liquidity against potential customer credit line draws or deposit outflows drove the increase.14 The results of this survey were released to the public yesterday and are available on the Federal Reserve Board’s website.
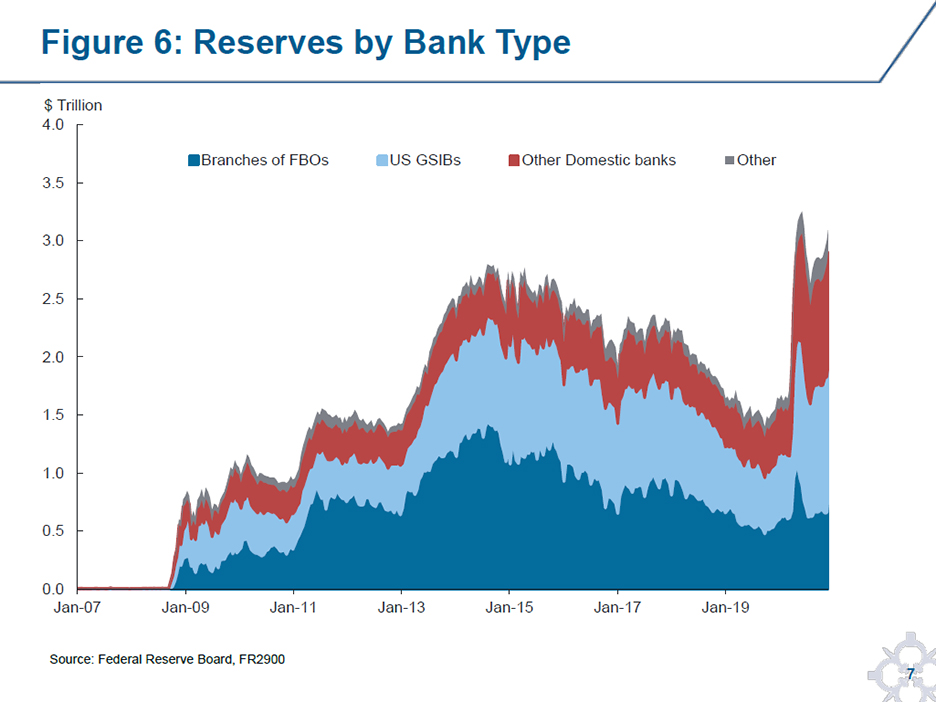
Interestingly, even as this elevated market uncertainty has receded and reserve levels have continued to increase, rates have remained near IOER, as indicated by the dark red dots. It could be that a greater comfort among domestic banks to hold higher reserve balances, at least for now, is contributing to rates continuing to trade near IOER. In the SFOS, the banks with higher reserve holdings since April indicated that their increase was motivated by a desire to maintain a buffer against deposit outflows, as well as the absence of attractive risk-adjusted investment alternatives.15 As shown in Figure 6, the growth in reserve balances has been particularly notable for the U.S. global systemically important banks (GSIBs) and large domestic banks that typically accumulate deposits.16 These banks collectively hold a much higher share of reserves than during the post-GFC period, when foreign banking organizations (FBOs) absorbed a greater share of the reserve increase.17
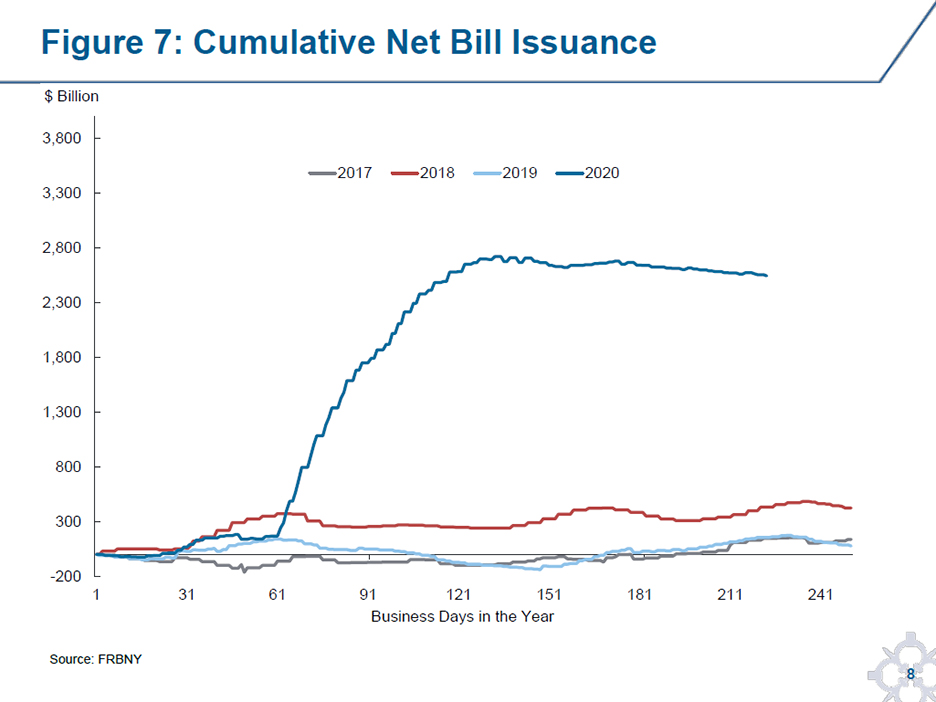
A second, and likely important factor, contributing to the higher level of rates relative to IOER is the significant increase in Treasury’s net bill issuance this year to fund fiscal stimulus, shown in Figure 7. Although Treasury bills are external to our stylized reserve demand curve, they are highly liquid and safe investment instruments, and an increase in the supply of Treasury bills tends to raise rates on a range of money market instruments that lenders consider to be substitute investments. Indeed, analysis by New York Fed colleagues finds that, controlling for changes in reserves, an increase of $1 trillion in the supply of short-term Treasury securities raises the spread of the effective federal funds rate relative to IOER by about three basis points.18 This helps explain some of the firmness in money market rates in recent months.
It is also possible that the configuration of the Federal Reserve’s administered rates within the target range has influenced the relative firmness in rates at times. The current spread between the IOER and ON RRP rates is narrower than during the earlier period of abundant reserves. Because of this, it would not have been possible for the effective federal funds rate to trade as far below IOER as it did during the 2014 to 2016 period, although this does not likely explain why rates are as close to IOER as they currently are.
Where Do Money Market Rates Go From Here?
Reserves over the near term seem likely to continue to grow, albeit at a slower pace than during the spring of this year. The degree and rate of growth will depend, in large part, on the path of asset purchases that the FOMC chooses. For example, in the Desk’s November Surveys of Primary Dealers and Market Participants, the median respondent expected net Treasury and agency MBS purchases to continue at the current pace through the end of next year before slowing in subsequent years. In addition, as I noted above, most market participants expect the Treasury Department to draw down the TGA balance over the medium term. Together, changes in Federal Reserve assets and liabilities such as these could add significant reserves to the banking system.
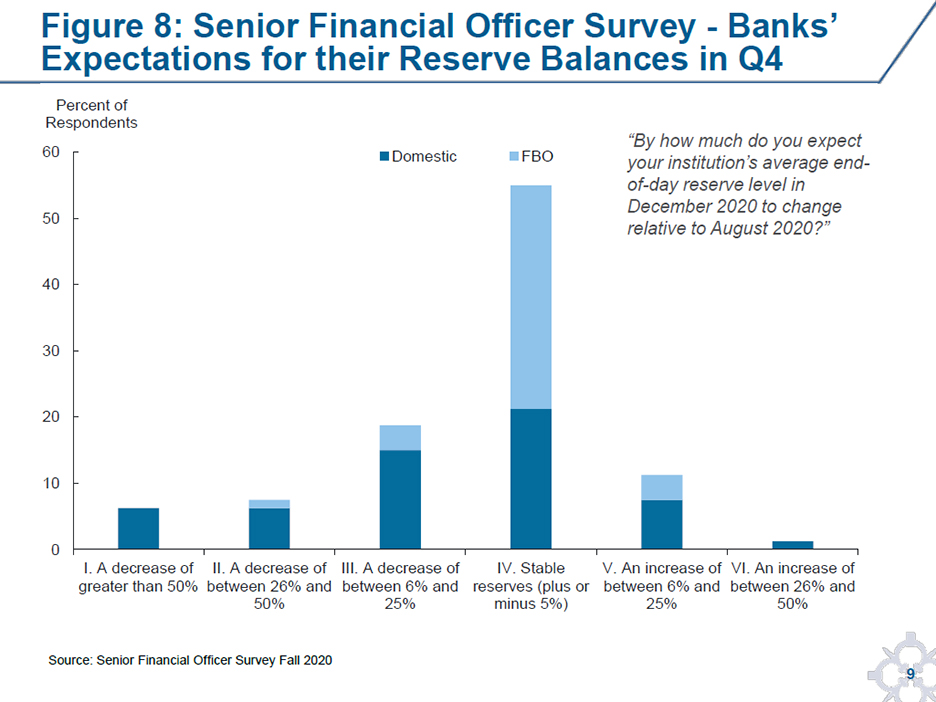
Even as aggregate reserve levels are expected to grow, many banks have suggested they will increasingly take actions to limit the growth in their own reserves. We have already heard from some banks that compression in net interest margins and changes in their regulatory ratios associated with higher reserve levels are making additional reserve growth less attractive for them.19 Indeed, even as market participants broadly expect reserve levels to increase in coming months, the majority of SFOS respondents expected their own reserve levels to be stable or decline, as shown in Figure 8. Many of these respondents reported that they intend to let wholesale funding and Federal Home Loan Bank (FHLB) advances run off, and to lower the rates they offer on certain deposits. It is important to note that these types of business changes take time to implement. So, even if reserves were to stay near current levels, these actions could put downward pressure on market rates.
Of course, as I described above, reserves remain in the banking system unless they are absorbed by growth in another Federal Reserve liability, or Federal Reserve assets decrease. The system is closed. Actions taken by individual banks to limit reserve growth can redistribute reserves to banks that have more capacity to absorb them, and money market rates adjust until banks in aggregate eventually demand the total amount of reserves being supplied.
During the 2010 to 2014 period, as rates declined, FBOs absorbed a significant amount of reserves, in part by taking on additional deposits from money market mutual funds. FBOs are natural borrowers in wholesale deposit markets and faced lower balance sheet costs associated with reserve growth than domestic depository institutions.20 It remains to be seen, however, if these banks will be as comfortable taking additional reserves in the current environment, or if other banks will step in to absorb reserve growth should rates fall.
Going forward, it seems likely that some of the factors that have been supporting rates this year—the increase in the TGA, highly elevated bill issuance, and domestic banks’ apparent comfort with reserve growth to date—will moderate or reverse. We will continue to monitor money markets closely to assess evolving conditions.
How Will the Fed’s Tools Work to Maintain Interest Rate Control?
As I noted above, the Federal Reserve has two important tools that can help maintain control over the federal funds rate and other short-term rates in this environment. IOER sets a benchmark against which banks evaluate short-term borrowing and lending opportunities, and this in turn passes through to other money market rates. When rates fall below IOER, the ON RRP maintains a floor on overnight rates by offering a broad range of money market investors an alternative risk-free investment option.21
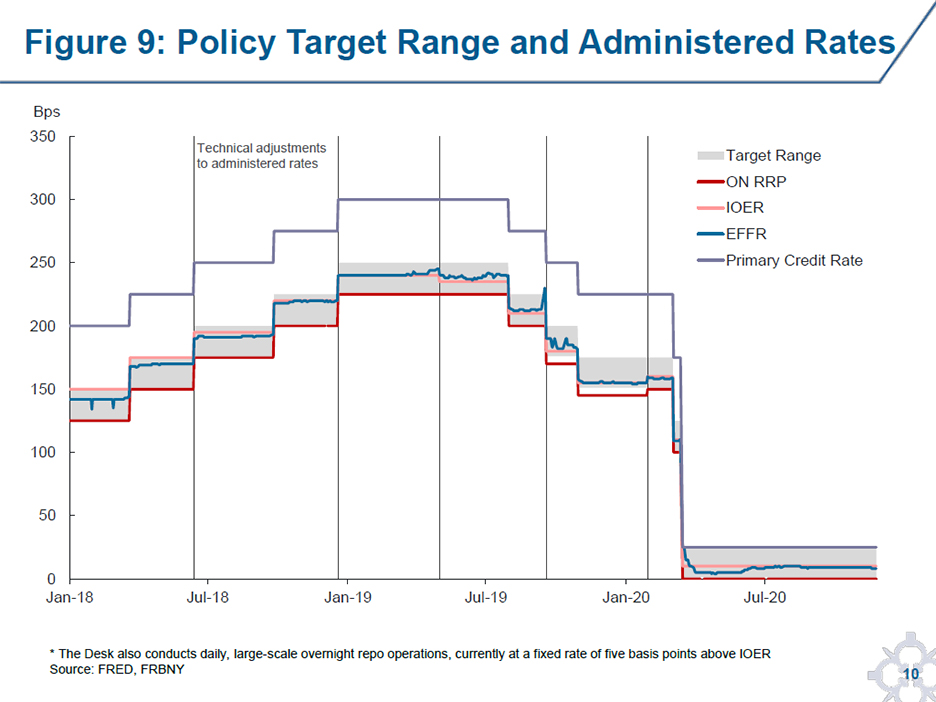
On occasion, the Federal Reserve has adjusted these administered rates to influence where the effective federal funds rate falls within the target range. Since 2018, the Federal Reserve has made five such adjustments to IOER and, as shown in Figure 9, each time the effective federal funds rate moved in line with the adjustment, demonstrating IOER’s strong influence. In instances where rates have drifted lower relative to IOER, the ON RRP has maintained a strong floor.22 Since 2016, the effective federal funds rate has not traded below the target range, even on balance sheet reporting dates when there can be strong downward pressure on rates.
As shown in Figure 9, IOER is currently set at 10 basis points, well below the top of the target range. If undue downward pressure on rates were to emerge, the Federal Reserve could adjust IOER higher to lift overnight rates. Even if this downward pressure persisted, the ON RRP would maintain a strong floor by providing an alternative investment for money market participants and, if needed, by reducing the quantity of reserves held by the banking system to relieve pressure on bank balance sheets. The Desk has over 120 counterparties to the ON RRP, representing a large majority of investors in the triparty repo market, giving this tool broad coverage to accomplish these objectives.23
Of course, we will respond to the environment as it evolves. The Federal Reserve stands ready to adjust the terms of the ON RRP and parameters of other tools as needed to ensure their efficacy.
Closing Remarks
In conclusion, I have been pleased that the FOMC’s implementation framework was able to support actions taken to address the pandemic, by smoothly accommodating a shift to much higher reserve levels. Given this significant increase in reserves, we might have expected money market rates to trade lower in the FOMC’s target range relative to IOER than they have, similar to the earlier experience with abundant reserves.
However, the factors that supported rates this year—the increase in the TGA, highly elevated bill issuance, and domestic banks’ apparent comfort with reserve growth to date—may moderate in 2021. As a result, rates could fall, reflecting an abundance of reserves. If this softness in rates emerges, it could help the financial system accommodate the growth in reserves by encouraging some banks to take on additional balances. Even if more persistent downward pressure on rates emerges, we are confident that the Federal Reserve has tools to ensure effective control over the federal funds rate and other short-term interest rates across the broad range of potential outcomes.


