Consolidated financial statistics for the U.S. commercial banking industry, including both bank holding companies (BHCs) and banks. Statistics are based on quarterly regulatory filings. Statistics are inclusive of BHCs' nonbank subsidiaries. Separate statistics are reported on a merger-adjusted basis for the subset of BHCs with >$500bn in total assets as of the current quarter, for BHCs with $50-$500bn in total assets as of the current quarter, and for the remainder of the industry.
View the 2025: Q3 report ![]()
Data for charts in the Quarterly Trends report is available in Excel format:
View the Quarterly Trends Report Data ![]()
View the Liberty Street Economics blog post associated with the inaugural 2012:Q2 report, Tracking the U.S. Banking Industry. >>
The Quarterly Trends report is generally posted approximately three months after the end of the quarter, shortly after the regulatory data for the quarter in question are finalized. If you have any further questions about the report, please contact research.publications@ny.frb.org.
Financial Statistics from the Quarterly Trends report
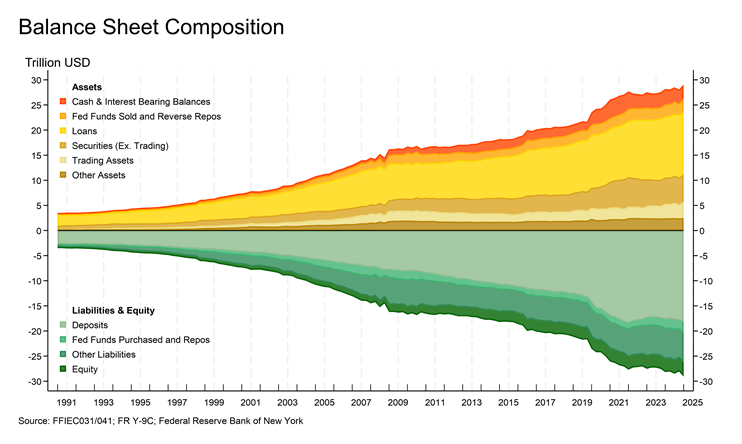
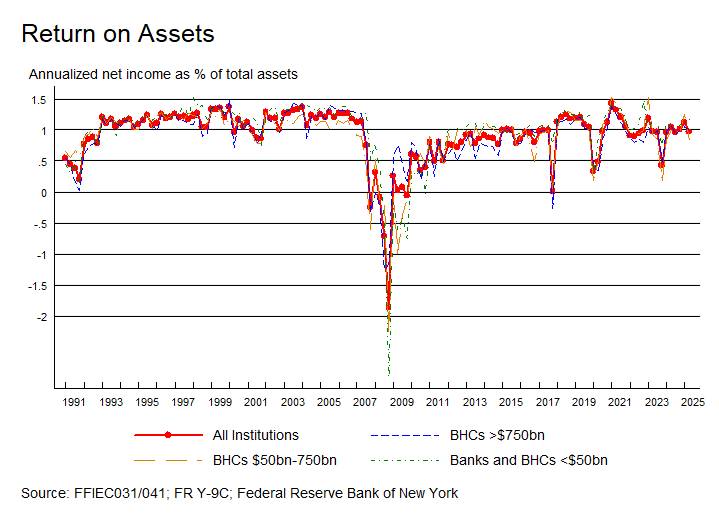
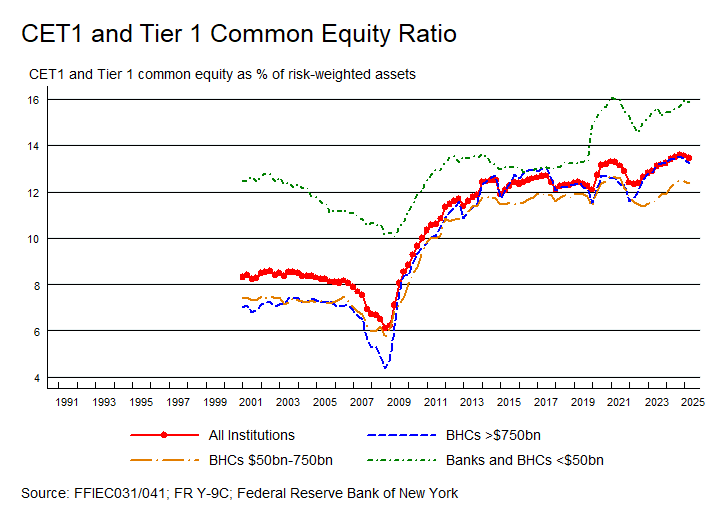
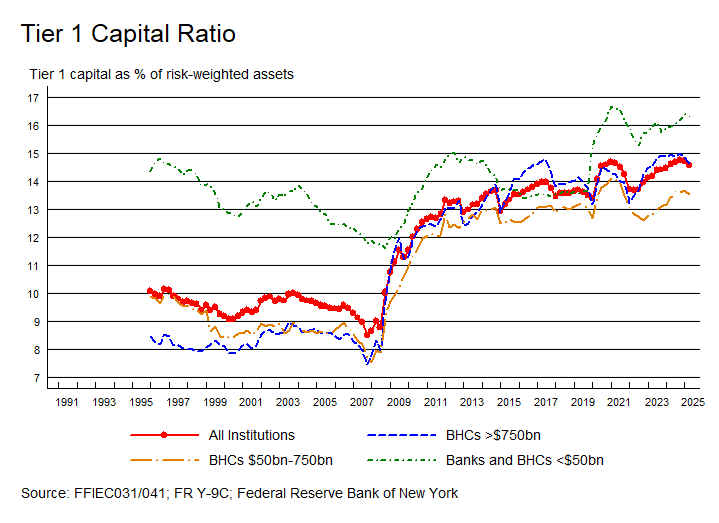
The figures below are drawn from the Quarterly Trends report. Please see the report itself for more detailed statistics and information about the methodology used to construct these charts.
A. Composition of Industry Assets and Liabilities

B. Earnings

C. Capitalization


Historical Reports:
2025: Q2 report ![]()
2025: Q1 report ![]()
2024: Q4 report ![]()
2024: Q3 report ![]()
2024: Q2 report ![]()
2024: Q1 report ![]()
2023: Q4 report ![]()
2023: Q3 report ![]()
2023: Q2 report ![]()
2023: Q1 report ![]()
2022: Q4 report ![]()
2022: Q3 report ![]()
2022: Q2 report ![]()
2022: Q1 report ![]()
2021: Q4 report ![]()
2021: Q3 report ![]()
2021: Q2 report ![]()
2021: Q1 report ![]()
2020![]()
2019![]()
2018![]()
2017![]()
2016![]()
2015![]()
2014![]()
2013![]()


