| Recapping an article from the November 2002 issue |
|
||
| of the Economic Policy Review, Volume 8, Number 2 | View full article |
||
|
|
16 pages / 166 kb | ||
|
Authors: Jason Bram, Andrew Haughwout, and James Orr |
Disclaimer | ||
| Index of executive summaries |
|
Overview Bram, Haughwout, and Orr consider whether the September11 attack on the World Trade Center could reverse or halt the higher income and improved quality-of-life trends enjoyed by NewYorkCity in recent decades.The authors argue that despite the attack's short-term disruption to the local economy, NewYork's favorable industry mix, production efficiencies, and quality of life should provide the foundation for continued positive trends over the medium term. Significantly, the supply of amenities available to city residents and businesses and the demand for city products and services suggest an encouraging future. That future, however, presents an important challenge for NewYork City’s policymakers: keeping the city attractive to firms and workers while closing a substantial budget gap.Background Over the past three decades, the New York City economy has been characterized by three notable patterns: little long-term employment change, rising real earnings, and appreciating land prices. Since 1969, average total employment in the city has been unchanged (chart), and real earnings of city workers have trended upward since 1980 at an average annual rate of about 3.5percent. Furthermore, while earnings per worker have increased nationwide since 1969, they have risen even more rapidly in NewYork(chart). The authors attribute the city's strong performance to enhancements in the productivity of existing jobs and an ability to capture a rising share of high-productivity jobs, most notably in financial services. In addition, the city’s housing prices have increased relative to the nation's since 1976(chart), suggesting that people will pay a premium to live in NewYork. Together, these patterns are consistent with the authors' model of NewYork as an attractive, mature city in an open, competitive environment.Argument and Methodology NewYorkCity's economic future depends largely on the continued strength of the city's supply of amenities—such as municipal services, safety, and public transit—and the demand for city products and services. The terrorist attack, in the authors' estimation, would therefore be most damaging if it upset these amenities or this demand. Accordingly, the study presents a medium-term outlook for these key "growth fundamentals" based on their pre-9/11 performance. This outlook is then considered in relation to the important policy challenges that will shape the city's future.Findings According to Bram, Haughwout, and Orr, NewYork's key growth fundamentals, which have enhanced the city's vitality over the years, point to continued gains. Since 1975, the city has strengthened its fiscal position, reduced its reliance on debt finance, lowered property taxes, and improved its financial reporting. Reductions in crime(chart) and enhancements to the public transportation system have also benefited firms and households. In addition, New York has a high concentration of some of the nation's fastest-growing industries (chart), with financial services standing out as the main driver of the local economy. The securities industry alone accounted for 5percent of city employment in 2000 and an estimated 20percent of earnings—shares that represented all-time highs. Adding to the encouraging prospects are national employment forecasts indicating that most of the city's key industries are projected to grow strongly over the next decade. The authors caution, however, that important policy challenges lie ahead. Whether the fiscal strains from the attack will reverse or halt any gains, they argue, will depend on how the city manages its finances and rebuilds damaged and destroyed infrastructure in Lower Manhattan. Specifically, local policymakers will have to close a substantial city budget gap without letting crime rise or municipal services deteriorate significantly, and without pricing NewYork's products and services out of the market. Judicious policy choices, along with the support of federal aid, will be vital to NewYork City’s economic growth. |
|
|
|
|
|
|
|
Total Employment in New York City and the United States |
|
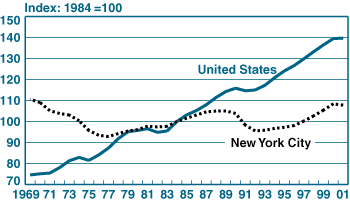
Source: U.S. Department of Labor, Bureau of Labor Statistics. |
|
|
|
Relative Earnings per Worker in New York City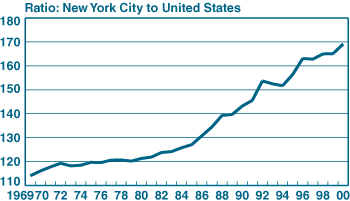 Sources: U.S. Department of Commerce, Bureau of Economic Analysis (earnings); U.S. Department of Labor, Bureau of Labor Statistics (total employment). Sources: U.S. Department of Commerce, Bureau of Economic Analysis (earnings); U.S. Department of Labor, Bureau of Labor Statistics (total employment).
Note: Earnings are nominal. |
|
|
|
New York City Area House Prices Relative to U.S. Average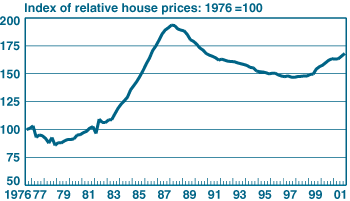 Sources: Office of Federal Housing Enterprise Oversight; Federal Reserve Bank of NewYork calculations. Sources: Office of Federal Housing Enterprise Oversight; Federal Reserve Bank of NewYork calculations.
Notes: The index is based on the ratio of the repeat-sales price measure for existing single-family homes in the NewYorkCity metro area to that of the UnitedStates overall; the index is designed to control for changes in the mix of homes sold. Data for the city itself are not available, so we present the index for the NewYorkCity primary metropolitan statistical area (PMSA), which consists of the city’s five boroughs (the Bronx, Brooklyn, Manhattan, Queens, and Staten Island) and Westchester, Putnam, and Rockland counties in NewYorkState. Approximately 80percent of the population of the New York PMSA lives within the city boundaries. |
|
|
|
Annual Crime Rate of New York City and the United States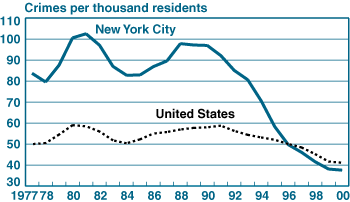
Sources: Federal Bureau of Investigation; NewYork State Division of Criminal Justice Services. |
|
|
|
|
Earnings Growth by Industry: UnitedStates versus NewYorkCity, 1995-2000 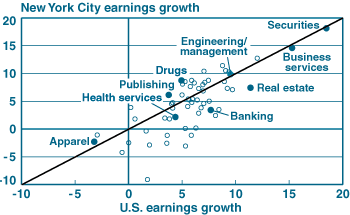 Sources: New York State Department of Labor; U.S. Department of Labor, Bureau of Labor Statistics. Sources: New York State Department of Labor; U.S. Department of Labor, Bureau of Labor Statistics.
Notes: Industries above the diagonal line registered faster earnings growth in New York City than they did nationally; those below the line experienced below-average growth in New York City. The dark circles represent selected two-digit Standard Industrial Classification industries that are important to the New York City economy. |
|
| Disclaimer | |
|
The views expressed in this article are those of the authors and do not necessarily reflect the position of the Federal Reserve Bank of New York or the Federal Reserve System. |
|


