| Recapping an article from the November 2002 issue |
|
||
| of the Economic Policy Review, Volume 8, Number 2 | View full article |
||
|
|
16 pages / 212 kb | ||
|
Authors: Jason Bram, James Orr, and Carol Rapaport |
Disclaimer | ||
| Index of executive summaries |
|
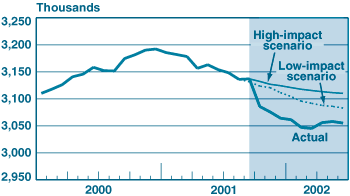
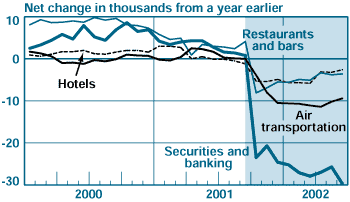
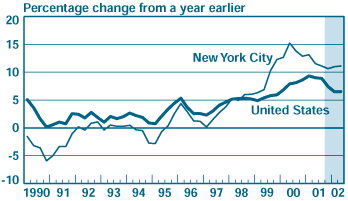
Overview Bram, Orr, and Rapaport present a detailed account of the costs of the World Trade Center attack. Using data through June 2002—the month in which the recovery process at the tradecenter site ended—they estimate that earnings losses, property damage, and cleanup costs total between $33 billion and $36 billion. Background The loss of human life and the destruction of commercial property and infrastructure on September 11 temporarily reduced the productive potential of the New York City economy. The attack directly affected economic activity in the area of the World Trade Center and also disrupted a number of industries located in other parts of the city. In this article, the authors seek to quantify the short-term economic impact of the attack on the city’s labor force and capital stock. Argument and Methodology The authors begin their analysis by calculating the “cost” of the nearly 3,000 lives lost in the World Trade Center attack. As a measure of this cost, they use the discounted value of the deceased workers’ expected future earnings. The authors’ estimates suggest that lifetime earnings losses for these workers were, in aggregate, roughly $7.8 billion—an average of $2.8 million per worker. The authors then assess the loss in earnings incurred by workers who were displaced from their jobs as a result of the attack. Explaining that a contracting economy had caused private-sector employment in the city to decline steadily in the months preceding September 11, the authors undertake to isolate the job losses attributable to the attack from those attributable to the business cycle. To this end, they employ a dynamic forecasting model to estimate what the path of New York City’s employment would have been had the attack not occurred (chart). They find that in October 2001, the number of private-sector jobs in the city was about 38,000 to 46,000 lower than it would have been otherwise. In February, the range moved to as high as 49,000 to 71,000, then eased to between 28,000 and 55,000 by June 2002. Using an estimated breakdown of these employment numbers by industry, the authors then translate the job shortfalls into wage and salary losses. The financial services, air transportation, hotel, and restaurant industries suffered the most severe job losses (chart); the garment and restaurant industries in Lower Manhattan also saw a significant drop in the number of hours worked by employees. Drawing on average earnings figures for each of these city industries, the authors estimate that job losses and work-hour reductions led to a total earnings shortfall of between $3.6 billion and $6.4 billion as of June 2002. Physical capital losses are the next cost component evaluated. The final cost of the cleanup and restoration of the World Trade Center site is expected to be about $1.5 billion. Another $16.4 billion will be required to replace or repair destroyed and damaged buildings at the site and its adjacent areas and to replace the buildings’ contents. Finally, the cost of repairing the damage to Lower Manhattan’s transportation, power, and communications infrastructure is expected to reach 3.7 billion. The authors also consider the impact of the September 11 events on New York City’s most economically vulnerable residents. They conclude that a sharp rise in Medicaid enrollment after September may be partly attributable to the attack, but find no evidence that the attack produced a significant increase in the city’s welfare rolls. Findings Adding up the earnings and physical capital losses, Bram, Orr, and Rapaport estimate the total cost of the World Trade Center attack to be between $33 billion and $36 billion. Looking forward, the authors suggest that much of the cost burden has already been borne. The World Trade Center site was cleaned up months ahead of schedule, and employment in the most clearly affected industries has shown signs of a rebound since March 2002. Housing market indicators remain surprisingly buoyant (chart), and survey evidence indicates that consumer confidence in the metropolitan area recovered strongly in the months following the attack. |
|
|
|
|
|
|
|
Path of New York City Private-Sector Employment |
|
 Sources: U.S. Department of Labor, Bureau of Labor Statistics; Federal Reserve Bank of NewYork. Sources: U.S. Department of Labor, Bureau of Labor Statistics; Federal Reserve Bank of NewYork.
Note: See Appendix B for methodology and a full explanation. |
|
|
|
Employment in Selected New York City Industries Source: New York State Department of Labor. Source: New York State Department of Labor.
Note: The shading indicates the post-September 11 period. |
|
|
|
Single-Family House Price Appreciation Source: Office of Federal Housing Enterprise Oversight. Source: Office of Federal Housing Enterprise Oversight.
Note: The shading indicates the post-September 11 period. |
|
| Disclaimer | |
|
The views expressed in this article are those of the authors and do not necessarily reflect the position of the Federal Reserve Bank of New York or the Federal Reserve System. |
|


