Good afternoon and thank you for inviting me to join this panel.
The panel’s topic—what we are normalizing to—is a key issue facing central banks as they normalize monetary policy after the crisis, and I hope to bring to this discussion an operational perspective from my position on the Federal Reserve Bank of New York’s Open Market Trading Desk. I will highlight three points: First, the Federal Reserve’s balance sheet, once normalized, is likely to be smaller than it is today but considerably larger than it was before the crisis, regardless of the type of operating regime the Federal Open Market Committee (FOMC or Committee) adopts in the long run. Second, while the FOMC could maintain interest rate control through a corridor system for its longer run monetary policy implementation framework, it would require a lot of learning by doing and would be unlikely to look like our pre-crisis corridor system. And third, based on what we’ve learned from operating a floor system thus far, it appears that this type of system can provide effective control of rates with operational simplicity. Before I continue, I should note that the views presented here are my own, and do not necessarily reflect those of the Federal Reserve Bank of New York or the Federal Reserve System.1
Last October, the Federal Reserve began the process of reducing the size of its balance sheet—a significant milestone in the ongoing monetary policy normalization process. Using a program of progressively increasing caps, we are gradually reducing the Fed’s securities holdings, which will reduce the supply of reserve balances in the banking system.2 This process will continue until reserves fall to a level that reflects the banking system’s demand for reserve balances and the FOMC’s decisions about how to implement monetary policy “most efficiently and effectively,” as noted in the FOMC’s Policy Normalization Principles and Plans.
However, there remains much uncertainty over what the “normal” size of the Fed’s longer-run balance sheet will be and how long it will take to get there. This uncertainty arises from numerous sources: We don’t know how fast our MBS holdings will pay down, how quickly currency outstanding will grow, how many bank reserves will be required for the efficient and effective execution of monetary policy, or how other liability items on the Fed’s balance sheet will evolve. The economic outlook also poses an ever-present source of uncertainty.
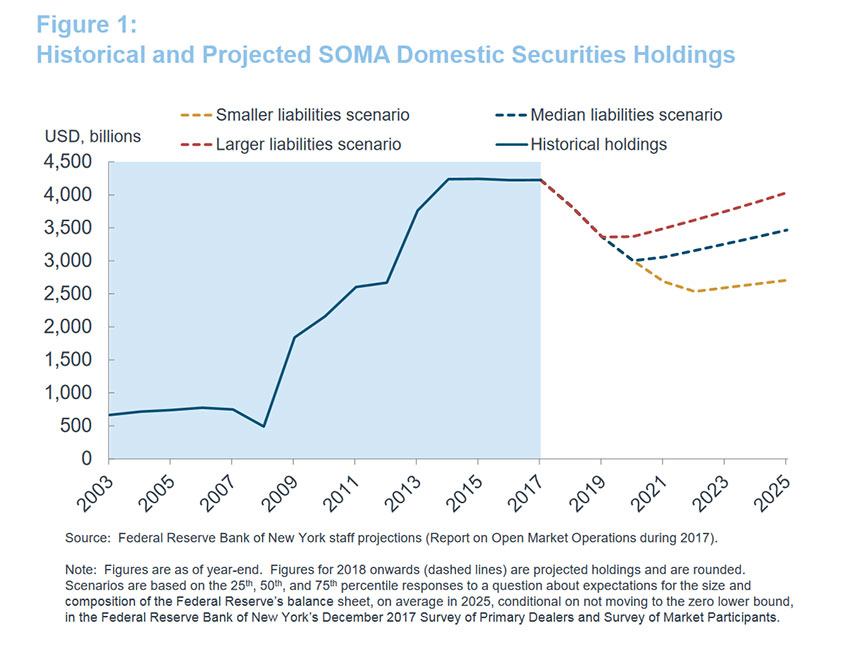
Although the Committee has not yet specified what a normalized balance sheet will look like, market participants’ expectations may provide some helpful context. The New York Fed’s most recent annual report on open market operations (released just a few weeks ago) presents a set of projections for possible paths of the Fed’s securities portfolio.3 As seen in Figure 1, the report shows three scenarios constructed from distributions of market participants’ surveyed expectations for the future size of the balance sheet.4 Survey-based expectations for the path of interest rates and some staff modeling fill in additional details. While these scenarios by no means embody the full range of possible outcomes, they suggest the domestic securities portfolio’s size could normalize at $2.5 trillion to $3.3 trillion, with the larger end of that range projected to be reached within two years. After its normalized size is reached, the portfolio is assumed to incrementally grow again as Treasury securities are purchased to keep pace with trend growth in liabilities, mainly currency.5
The projection exercise illustrates a key point: The Fed’s future balance sheet will likely be considerably larger than its pre-crisis level. This outcome is likely regardless of the design of the operating regime that the Committee ultimately uses to manage short-term interest rates. The normalized size will be determined by the liability side of the Fed’s balance sheet, which will reflect two driving factors: Growth in non-reserve liabilities, and a potential shift in the structural demand for reserves.
First, there has been substantial growth in the Federal Reserve’s non-reserve liabilities in recent years, and some factors are expected to grow further, as seen in Figure 2. U.S. dollar currency in circulation tends to grow over time and has more than doubled since the start of the global financial crisis, to a current level of $1.6 trillion.6 The median survey response implies an expectation for currency to grow to around $1.8 trillion at the time the size of the portfolio normalizes—in other words, the portfolio will need to be $1 trillion larger than before the crisis just to back currency in circulation. Meanwhile, various account holders—including the Treasury Department, foreign and international official institutions, government-sponsored enterprises (GSEs), and designated financial market utilities (DFMUs)—have increased their balances held in Federal Reserve accounts or investment services, which currently represent over $700 billion in additional liabilities.
Second, it is likely there has been a shift in the structural demand for reserves, driven largely by banks’ response to changes in regulations and risk appetite that favor safe assets, particularly reserves. If the demand curve for reserves has indeed shifted out, the amount of reserves the Federal Reserve will need to supply to achieve a given interest rate target will be comparably larger than it once was.
The FOMC acknowledged in last June’s addendum to its Policy Normalization Principles and Plans that it anticipates a future level of reserve balances that is “appreciably below that seen in recent years but larger than before the financial crisis.”7 In the three projection scenarios I’ve shown, reserve balances (as derived from market participants’ expectations) are assumed to be around $400 billion, $600 billion, and $750 billion once a normalized balance sheet size is reached, well below the current level of $2 trillion and consistent with the Committee’s statement. However, we have insufficient information to identify what factors inform these views.
Taking reserves and non-reserve liabilities together, I see virtually no chance of going back to the pre-crisis balance sheet size of $800 billion. Thus, discussion of whether to have a large or small balance sheet in the long run partly misses the point. The conversation is really about the relative amount of reserves, which will be governed both by the banking system’s demand for reserve balances—something we will learn more about during the process of balance sheet normalization—and by the Committee’s future decisions around how to implement monetary policy most efficiently and effectively.
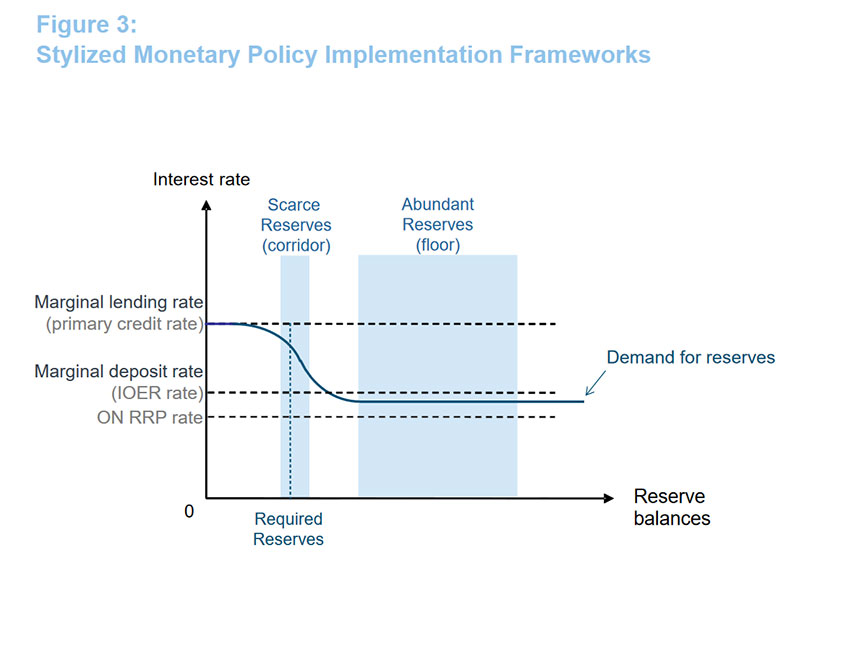
Debates about monetary policy implementation regimes generally center on two frameworks, illustrated in stylized form in Figure 3. The traditional framework—a version of which the Fed used before the crisis—is a corridor system, which is generally associated with a scarce supply of reserves. Policy is implemented through frequent adjustments to the supply of reserves, such that the supply intersects the steep portion of the reserve demand curve at the desired overnight interest rate. Fluctuations in reserves stemming from autonomous factors are borne by the private sector through the central bank’s open market operations. In contrast, the framework used to implement policy today is a floor system, which is associated with an abundant supply of reserves and policy implementation that is achieved through periodic changes to administered rates. A floor system is generally associated with a relatively larger balance sheet than a corridor system because the central bank needs to supply enough reserves to satisfy demand on the flat part of the reserve demand curve, perhaps with an additional buffer to accommodate reserve supply shocks. Such shocks typically stem from fluctuations in other liabilities.8 However, we do not really know how large or small a difference in the amount of reserves would be needed to run an effective and efficient floor versus a corridor in the longer run. The answer will depend critically on the shape of the demand curve, which we will learn more about over time, as well as the specific design parameters of either framework.
I would emphasize that central banks have successfully implemented both types of frameworks, or variations of them, and that the Fed can achieve interest rate control with either one. Leaving aside some of the broader policy considerations, I’d like to make a few points about the technical operation of each framework in the longer-run.
First, some observers see a return to the Fed’s pre-crisis, reserve-scarce corridor system as the natural conclusion to the normalization process, highlighting that system’s familiarity. But it is important to note that fundamental changes in the money market landscape over the past decade would likely make monetary policy implementation in a future corridor system look substantially different than before the crisis.
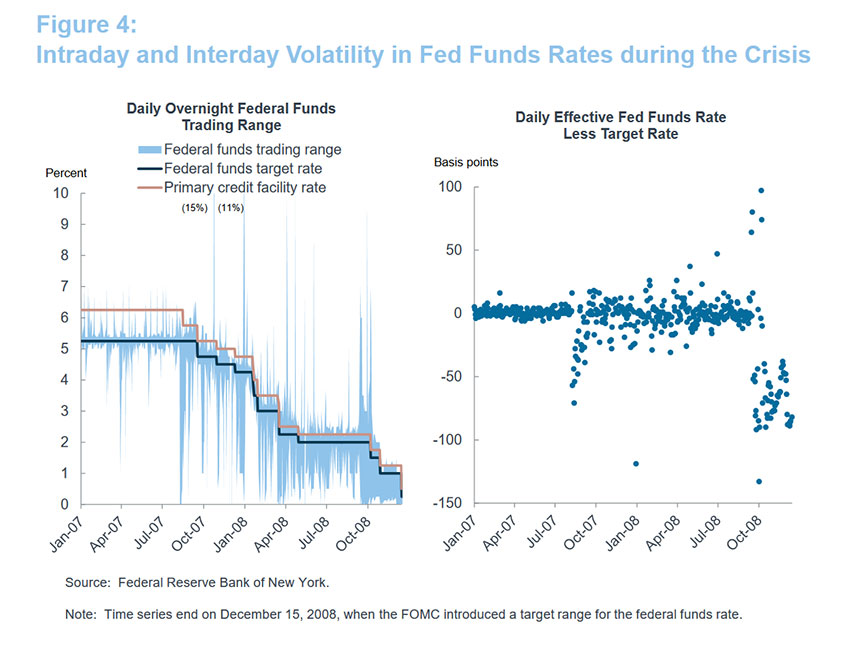
In the Fed’s pre-crisis regime, hitting the target federal funds rate each day was a technically challenging exercise. Demand for reserves was driven largely by reserve requirements, in addition to intraday payment clearing needs. We started with a banking system that on most days was short of reserves. Then, using staff forecasts of various factors affecting the supply of and demand for reserves over multiple days ahead, we calibrated open market operations with the dealers in the repo market to bring the aggregate supply of reserves into balance at the target rate. With this aggregate balance achieved, individual banks distributed them. Banks facing a deficiency of reserves needed to find and trade with banks holding reserve surpluses, each balancing the costs associated with holding too many or too few reserves.9, 10 We were reliably proficient in hitting the FOMC’s target rate in normal times, but interest rate control was more challenging at times when factors affecting reserves were harder to predict. This was particularly true in the early stages of the crisis, when large changes in reserve demand caused significant intraday and interday swings in federal funds rates (Figure 4).11, 12
Today, with greater uncertainty and variability in factors affecting the day-to-day demand for and supply of reserves, it would be more difficult to anticipate fluctuations and achieve the necessary balance in reserve conditions even in normal times. In aggregate, reserve demand is likely to be guided by a more complex set of drivers, including post-crisis liquidity regulation, supervision, resolution planning, and intraday payments risk management. These needs have the potential to contribute to higher and more variable demand for reserves than banks had before the crisis.13 Estimating reserve demand would need to take into account these factors, as well as banks’ propensities to substitute between reserves and other relevant assets—something that may vary according to an individual institution’s business strategy. Knowledge about the shape, position, and stability of banks’ reserve demand curve will likely emerge only with experience.
Additionally, we would need to consider shocks that affect the supply of reserves, such as those stemming from changes in the Fed’s non-reserve liabilities. As seen in Figure 5, net changes in non-reserve liabilities have become more variable in recent years.14
Even if fluctuations could be accurately forecast, in a corridor system, they would need to be offset through open market operations to maintain interest rate control. Larger fluctuations would likely require larger operations.15 In the years before the crisis, the average size of daily overnight repo operations was around $5 billion—a relatively small amount given the size of the repo market and dealers’ net securities financing needs. Roughly 95 percent of these operations were for less than $10 billion, and the maximum operation size in normal times was $20 billion. Looking just at recent variability in non-reserve liabilities and assuming overnight operations were used to offset their fluctuations, daily temporary operations in a corridor system might routinely need to be around $25 billion, but could go as high as $100 billion.16 We would need to consider whether the Fed’s repo and reverse repo operations could be dependably scaled to that degree, and whether their effects would be transmitted to other rates.
One consideration in this regard is that there appear to be greater frictions across funding markets today. Dealer balance sheets have shrunk and become less elastic in the face of changes in regulation and risk management.17 While dealer caution contributes to the overall safety and soundness of the banking sector, it could mean we would need more or different types of counterparties for traditional repo operations, or perhaps different types of operations altogether—particularly if federal funds trading became idiosyncratic or disconnected from other rates. In sum, a reinstated corridor might look less familiar than some expect.
For comparison, let me make a few observations about our experience with the floor system that the Fed is currently using. The FOMC has successfully raised its target range for the overnight federal funds rate six times since December 2015, and, as seen in Figure 6, the effective federal funds rate has reliably printed in the prevailing target range over that time. The policy stance has transmitted to a broad constellation of money market rates. The system is simple and efficient to operate. The interest rate the Fed pays on excess reserves serves as the primary policy implementation tool, with support from a standing facility that offers overnight reverse repos (ON RRPs) at an administered rate.18 There is no need to forecast specific factors affecting reserves or to conduct discretionary open market operations each day; overnight reverse repos are offered every day based on price, not quantity. Day-to-day fluctuations in factors affecting reserves are accommodated by the elastic reserve demand given that reserve needs are widely met. Market forces keep the federal funds rate in the FOMC’s target range by allowing a wide range of counterparties to price trades against the alternative option of investing with the Federal Reserve. And in the aggregate, use of the Fed’s balance sheet is efficient by allowing private and official sector market participants to determine their preferred distribution across the range of Fed liabilities.19
This system could continue to work well with considerably lower levels of reserves, so long as the supply continued to intersect the flat part of the demand curve. If reserves fell too low, we could see high volumes of fed funds borrowing at interest rates well above the interest rate on excess reserves, which would indicate that we were no longer operating at the flat part of the demand curve.20 As I noted earlier, maintaining a buffer of excess reserves to absorb reserve-draining shocks could prevent this outcome. An important trade-off arises between the size of that additional buffer and the frequency and size of open market operations.21
To sum up, the FOMC could choose to retain the floor system to implement policy in the longer-run or it could choose to shift back to a corridor system. However, a reinstated corridor system may be less familiar than some expect. Such a framework would involve uncertainties about reserve demand and greater variability in factors affecting reserve supply, and would likely require operations that are larger, more variable, or even very different from those used before the crisis. Meanwhile, those who favor a floor system may be encouraged by the performance of our current framework to date. We’ve learned that the floor system has proven to be highly effective at controlling the effective federal funds rate and other money market rates, is resilient to significant shifts in market structure, and is efficient to operate. Under either framework, the balance sheet will likely normalize at a level substantially larger than it was before the crisis to accommodate higher demand for reserves and non-reserve liabilities in the post-crisis landscape.


