Albany Metro Area
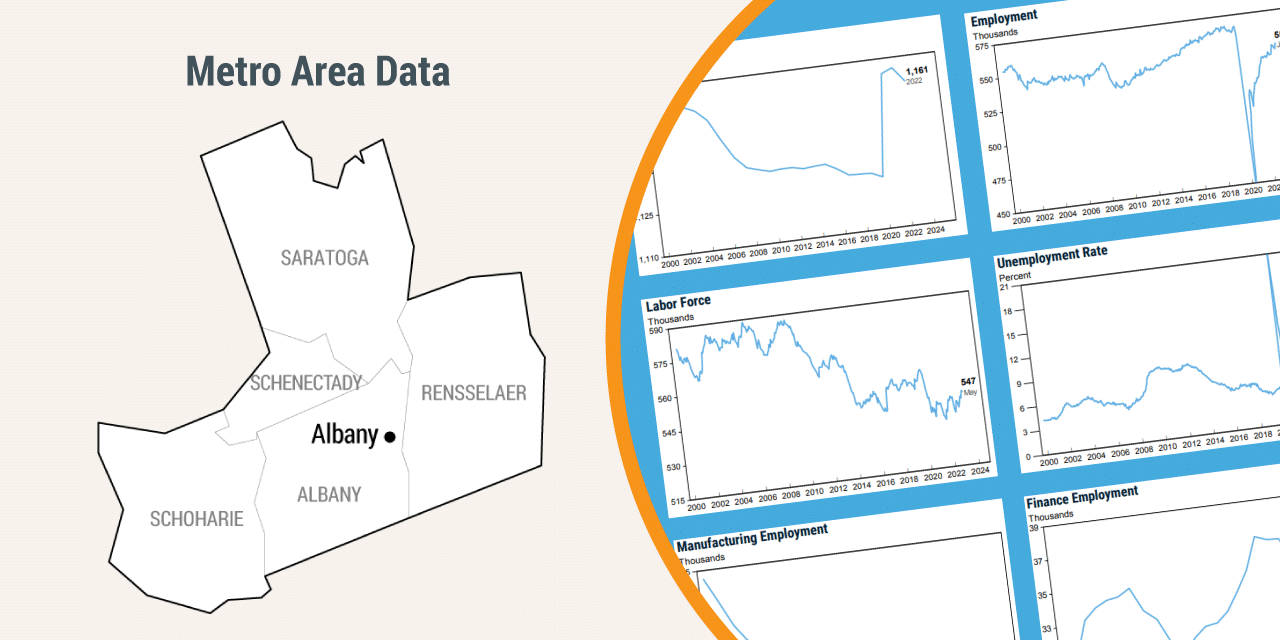
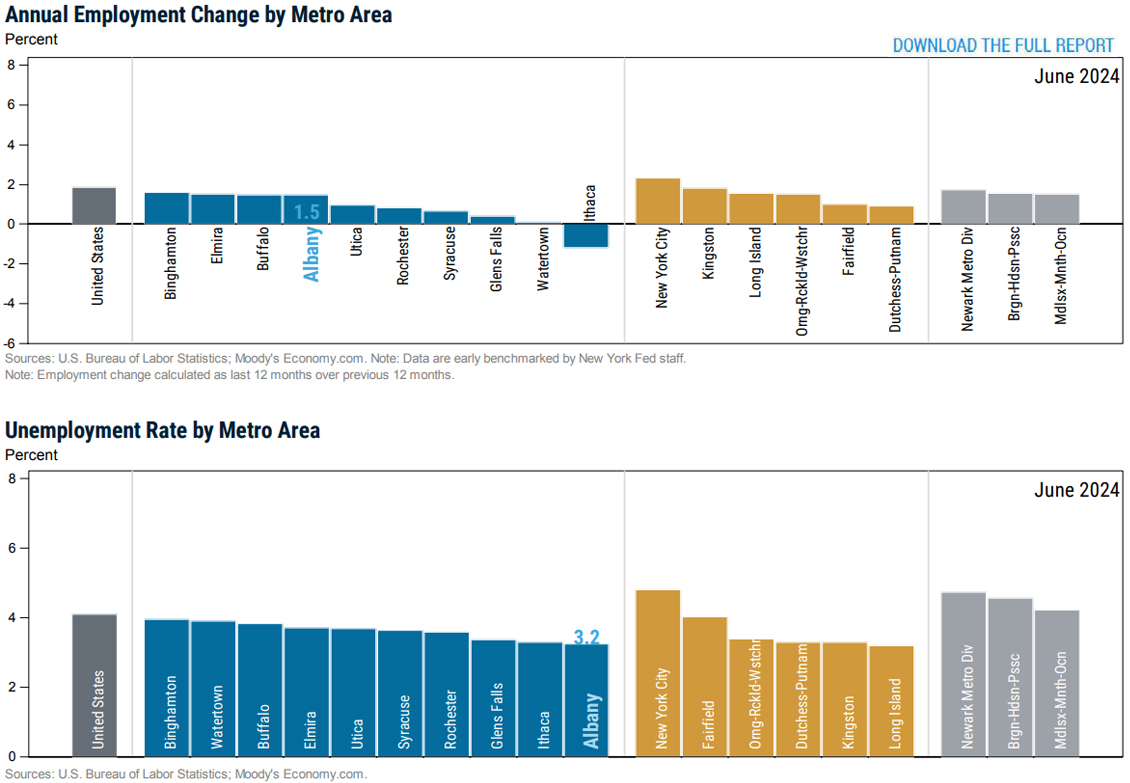
Albany serves as the capital of New York State, and the metropolitan area is home to roughly 900,000 people. It is among the most well-educated, affluent, and fastest-growing areas in upstate New York, buoyed, in part, by the presence of state government, which has helped attract skilled workers and insulate the regional economy during economic downturns.
Albany Metro Area Economic Indicators
Economic and Demographic Trends
| Population 2024 | Pop growth 2024, 10-year change (%) | GDP 2023, billions ($) | Job growth 2024, 5-year change (%) | Median household income 2023 ($) | Median home price 2023 ($) | Pop share age 25+ with BA+ 2023 (%) | |
| Albany | 913,485 | 3.0 | 85 | 0.0 | 80,000 | 275,000 | 40.6 |
| Glens Falls | 125,127 | -2.6 | 9 | -3.5 | 72,600 | 240,000 | 30.8 |
| Utica | 287,932 | -3.2 | 16 | -4.7 | 59,200 | 180,000 | 27.9 |
| New York State | 19,867,248 | -0.7 | 2,183 | 0.8 | 80,150 | 400,000 | 40.7 |
| United States | 340,110,988 | 6.5 | 27,812 | 4.7 | 76,170 | 325,000 | 36.2 |
Sources: U.S. Census Bureau; U.S. Bureau of Labor Statistics; NYSDOL; U.S. Bureau of Economic Analysis; IPUMS USA-University of Minnesota; New York Fed calculations. Data retrieved through data.census.gov, Moody's Economy.com, or directly from source.
*These are neighboring metro areas.
The New York Fed publishes indicators, trends, research and analysis on our Second District. Explore the content below to learn more.
February 10, 2026
January 30, 2026
January 30, 2026
January 16, 2026
January 15, 2026
January 14, 2026
November 2025
Richard Deitz and Kartik Athreya | September 23, 2025
By Jaison R. Abel, Richard Deitz, Natalia Emanuel, Ben Hyman, and Nick Montalbano | September 4, 2025
By SHAWN PHILLIPS | August 7, 2025
BY Matteo Crosignani and Martin Hiti | July 1, 2025
BY Jaison R. Abel, Richard Deitz, Sebastian Heise, Ben Hyman, and Nick Montalbano | June 4, 2025
March 25, 2025
BY Jake Scott, Ambika Nair, and Claire Kramer Mills | March 6, 2025
By Jaison R. Abel, Richard Deitz, and Ben Hyman | March 5, 2025
BY Jaison R. Abel, Richard Deitz, Natalia Emanuel, and Benjamin Hyman | September 4, 2024
BY Jaison R. Abel and Richard Deitz | May 20, 2024
May 20, 2024
May 7, 2024
By continuing to use our site, you agree to our Terms of Use and Privacy Statement. You can learn more about how we use cookies by reviewing our Privacy Statement. 


